1 in Every 3,547 housing units faced Foreclosure in January 2026 fl, nv & de leAD
BRICS Nations GDP vs The united States of America GDP
What is BRICS
What is BRICS
What is BRICS

BRICS is a major, expanding, and informal alliance of emerging economies—originally Brazil, Russia, India, China, and South Africa—aiming to create a more "multipolar" world by reducing dependence on the US dollar and Western-dominated financial institutions. As of 2025-2026, the bloc includes new members like Iran, Egypt, Ethiopia, Saudi Arabia, the UAE, and Indonesia, together representing roughly half the world's population and over 40% of the global economy
Brazil
What is BRICS
What is BRICS
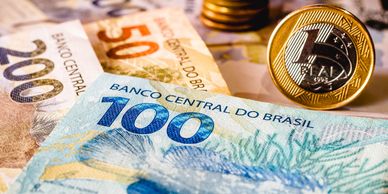
The Brazilian Real (BRL) uses banknotes in denominations of R$2, R$5, R$10, R$20, R$50, R$100, and R$200, along with coins for R$1 and centavos (5, 10, 25, 50 centavos), with the 1 centavo coin being rare and the R$1 coin common, replacing the older R$1 note.
Brazil's nominal GDP per capita was approximately $10,280–$10,580 USD in 2024–2025, reflecting a post-pandemic recovery and moderate economic growth
Russia
What is BRICS
Russia

The ruble is the second-oldest currency in continuous use, after the pound sterling, as well as the first decimal currency. The ruble was the currency of the Russian Empire and later the Soviet Union, where it was known as the Soviet ruble.
Trade partners include BRICS, WTO, EAFU, CIS, GECF, APEC, and G20.
India
South Africa
Russia
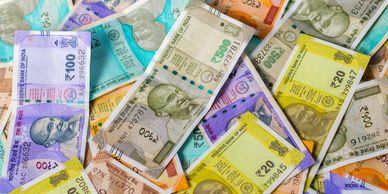
The Indian rupee (INR) is the official currency of the Republic of India and is issued by the Reserve Bank of India. The rupee is subdivided into 100 paise. The symbol of the Indian rupee is ₹.
- India has one of the fastest-growing economies in the world.
- Exports include precious metals and stones, jewelry, mineral fuels, oils, vehicles, parts and accessories, and pharmaceutical products.
- Imports include fuels and mining products, electrical machinery and equipment.
China
South Africa
South Africa
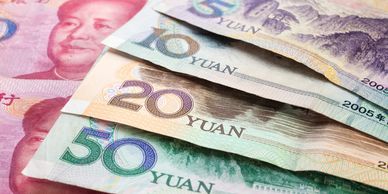
China's GDP per capita (nominal) was approximately $13,300–$13,314 in 2024, continuing to rise as the nation remains an upper-middle-income economy. Projections for 2026 indicate a potential increase to over $14,700. While rising, this remains significantly lower than that of the U.S. and is characterized by high, uneven regional, and urban-rural disparities.
South Africa
South Africa
South Africa

South Africa's nominal GDP per capita is estimated to be approximately $6,600 -$6,800 in 2025–2026, positioning it as one of the higher-income nations in Africa, though growth remains slow. The Purchasing Power Parity (PPP) GDP per capita is significantly higher, estimated at over $16,000 in 2026, reflecting a higher cost-of-living adjusted value
BRICS Nations
Iran
United Arab Emirates (UAE)
United Arab Emirates (UAE)

Iran's GDP per capita (nominal) is approximately $4,074 to $4,810 as of 2024-2025 data, classifying it as a lower-middle-income nation. When adjusted for purchasing power parity (PPP), the GDP per capita is significantly higher, estimated around $21,000-$21,800, placing it roughly 88th-90th globally. Growth has been moderate, but it faces challenges with inflation
United Arab Emirates (UAE)
United Arab Emirates (UAE)
United Arab Emirates (UAE)
The UAE's GDP per capita is among the highest in the world, with estimates for 2025/2026 placing it between approximately $49,000 and $53,000 in nominal terms. When adjusted for purchasing power parity (PPP), the GDP per capita is significantly higher, estimated at over $73,000 to $85,000, reflecting strong purchasing power.
Egypt
United Arab Emirates (UAE)
Ethiopia
Egypt's GDP per capita (nominal) was approximately $3,338 to $3626 in 2024–2025, reflecting a decline from previous years due to currency fluctuations, while purchasing power parity (PPP) adjusted GDP per capita is significantly higher, estimated around $16,798 to $21,759in 2024–2025. The economy faces challenges, with 2025 GDP growth estimated at 4.3%.
Ethiopia
Saudi Arabia
Ethiopia
Ethiopia's GDP per capita is approximately $1,134 USD (nominal 2024-2025), reflecting a growing, yet developing, economy, with projections suggesting a slight increase to around $1,272–$1,382 USD by 2026. The country’s GDP per capita adjusted for purchasing power parity (PPP) is estimated to be significantly higher, often cited above $3,000–$4,000, depending on the source
Saudi Arabia
Saudi Arabia
Saudi Arabia
As of early 2026, Saudi Arabia's nominal GDP per capita is estimated to be approximately $35,839 according to IMF projections. When adjusted for purchasing power parity (PPP), which accounts for relative living costs, the GDP per capita is significantly higher, projected to exceed $77,000 in 2026. The nation remains a high-income economy driven by its massive energy sector
Indonesia
Saudi Arabia
Saudi Arabia
Indonesia's GDP per capita (nominal) was approximately $4,925–$5,335 in 2024–2025, reflecting steady economic growth. The purchasing power parity (PPP) adjusted GDP per capita is significantly higher, estimated at over $18,000–$22,000, indicating a higher local standard of living. The economy is driven by services, industry, and a large population

Why a Finance Coach Makes Cents
Build a Net Worth Living Paycheck to Paycheck